Timing Solution: all about
the projection line; software description
Timing Solution versions compared (click here)
Timing Solution Pattern Recognition (click here)
Projection line is our main product
I remember attending first in my life seminar
on trading and technical analysis. It was held by the representatives of some
famous international software producer that sells packages for traders and investors. I have
anticipated so much... And I have been quite confused there. The lecturer said something like this: "Trading is easy; buy when the price is low and
sell when the price is high". Somebody from the public asked: "How do we
know whether it is high or low?" The lecturer looked uncomfortable with
that
question. He planned to tell us about the beauty of moving averages and other smart indicators
of technical analysis, Fibonacci levels, trend lines, etc. It is true that all these
techniques give us a lot of useful hints regarding the future price movement;
however the main question of how to find out what the future price movement will
be is
still unclear. Thousands of hints provided by technical analysis cannot
substitute the answer to that main question: "When the next high (low) of the market will
occur?".
Timing Solution software is oriented totally to answering this
question. We do not invent tons of new technical analysis indicators
(though sometimes we do); many software designers have already followed
that path. What we do is the modeling
of the stock market behavior based on the state-of-the-art math methods, our
own observations and analysis of the knowledge gathered by others. Below we explain how we do this.
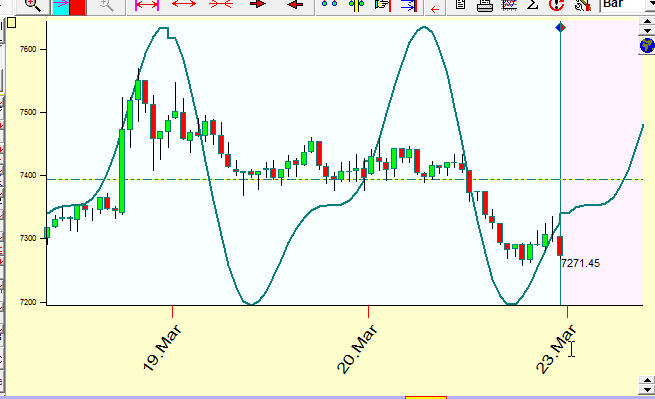
If you are a very busy person or simply do not like going into the depths of sophisticated math methods that lie behind the procedure of making the projection line, you may avoid it using a kind of "One button" solution. There is a set of ready solutions in the program that allows to generate projection lines based on fixed cycles, astronomical cycles and other types of models. You have to download the price history, click the "Solutions" button. In a couple of minutes you get a projection line that can be prolonged into the future beyond the "Now" point. It is ready for use:
This is all that you have to do. However, it is not that simple for the program. While running your chosen solution, the program conducts several thousands of operations that include very sophisticated math. The projection line is our main product; we analyze the past price history and make a future projection based on our current knowledge of the past.
The forecast itself may be based on different models, below we will discuss some of them:
Astronomy/Astrology based models
Here we consider models that deal with natural cycles, cycles that are based on celestial bodies movements. We follow a tradition here: the ancient knowledge about the Sun and the Moon's cycles is the basis for all calendars. There is no doubt about the importance of these cycles, neither in old times nor nowadays. Timing Solution allows to work with all astronomical cycles, and I can say that the most reliable models are based on these cycles.
As an example, please see this Annual/Seasonal cycle calculated for Dow Jones Industrial index (the calculation is done for DJI historical data starting from the year 1885):
Another example of a cycle is Moon phases. We can say that Dow is high around the New Moon and it is low several days before the Full Moon (as a rule):
 *
*
We can calculate in a similar way any known astronomical cycle and compare it to our data. See this long term Jupiter cycle (which is very close to Juglar business cycle):
Here is one more example. This is a pure astrological view of the stock market; it is provided by four Bradley Barometer projection lines adjusted for Dow:
All above mentioned models are only a small part of what is available in Timing Solution. The Neural Network module of the software allows to calculate projection lines based practically on any astro phenomena. We can calculate the projection line based on midpoints or transiting houses (for intraday) (more details are here), or planetary positions in houses, or planetary dignities (more details are here), or waxing/waning aspects between the planets (more details are here), or planetary speed (more details are here).
All of these can be done with Timing Solution software.
You can perform more detailed astrological analysis using standard astrological techniques. The program displays stock market data together with planetary positions in Zodiac:
as well as planetary positions in terms, faces, duads, the Moon (or any other planet) ingresses to Zodiacal degrees (which is useful for intraday trading) and many other phenomena.
The "Upcoming Events" module performs the statistical
analysis for hundreds of astrological phenomena and shows how they may affect
the stock market in the future:
The Easy Expert module analyzes thousands of events and displays the summary effect of all analyzed phenomena this way:
Up and down arrows represent up and down events.
Planetary Lines module:
Planetary Lines optimizer module analyzes thousands and thousands of planetary lines and finds the best fit to your price chart. look at this example:
The program analyzes 42.000 different planetary lines; it has found only a dozen of planetary lines that fit your price chart. To do this huge computational job manually is practically impossible.
Universal Language of Events (ULE) module allows to create more advanced models analyzing everything that occurs in time and researching the effect of these phenomena on the stock market. Here are some examples:
Look at the calculated periods when Mercury has been retrograde:
You may calculate as well the "retrograde indicator" that shows how many planets are retrograde at any given moment. The higher the diagram, the more planets are retrograde at that moment:
Or you may create another "astro indicator" like this one that shows how the transiting Sun conjuncts the midpoints between transiting planets. The higher the diagram, the more midpoints are hit by the transiting Sun:
Let us look at other examples. Take as an ULE event "Venus gravitation force":
or the tidal force:
or the moments when the planets culminate (this event may be applied for intraday data):
or other astro indicators like Ganue, Barbot, Berg, Index of Cyclical variations:
All these sample models can be applied later for analysis of any financial instrument of your choice. If the correlation is found, you can make a future projection of the model in regards to your financial instrument.
Our software does more complicated things, and it does it very fast. It takes you just a couple of seconds to generate a projection line based on non-standard wave forms. For example, see below the projection line based on "triangular" wave forms. The Spectrum module provides the information on the strongest cycles while ULE module performs a huge amount of operations adjusting these triangle waves (three major waves in the bottom part of the chart below) to your financial instrument. This huge job is done within seconds by a small amount of mouse clicks:
Any phenomenon can be calculated and estimated in regards to its effect on the stock market. And you can easily do it with Timing Solution. For example, somebody says that the conjunction of the Sun and Saturn affects Dow Jones Index in some specific way. Instead of
debates - should you believe it or not, - you can check this information in a moment
by running the Efficiency Test module for this aspect. Here it is:
It shows that a week after the culmination of this aspect the price tends to go down: 74 times down versus 48 times up
(the control group shows 54 down versus 68 up, Chi square=7.4, probability=99.3%)
There are 50 categories of ULE events in total (as of March 2009), and this list is constantly growing.
Math cycles models
The idea that the stock marked is ruled by underlying cycles is the most exciting idea of financial analysis. We mean here not astronomy based cycles, but math cycles - like a cycle with the period of 55 days, or 34 bars (for intraday price history), like in this example:
So, if we trust this idea and are able to reveal these cycles, we can assume that the cycles can work for some period of time. Therefore, we can prolong them into the future and obtain the answer that any trader wants to know - how the price will move in the future.
Timing Solution arms you with very powerful tools to work with these cycles. You do not need to know all math nuances of spectral analysis, or wavelet analysis or MESA or Neural Network technology. This is our part, and this is what we can do.
You simply ask the program to reveal the most powerful cycles (dominant cycles) for your financial instrument. Here they are; look at the peaks of this diagram:
Then you just drag these cycles to the screen where the price chart is, to obtain the projection line based on these cycles:
The program does itself what has to be done. And as always, this projection can be prolonged into the future as long as you need.
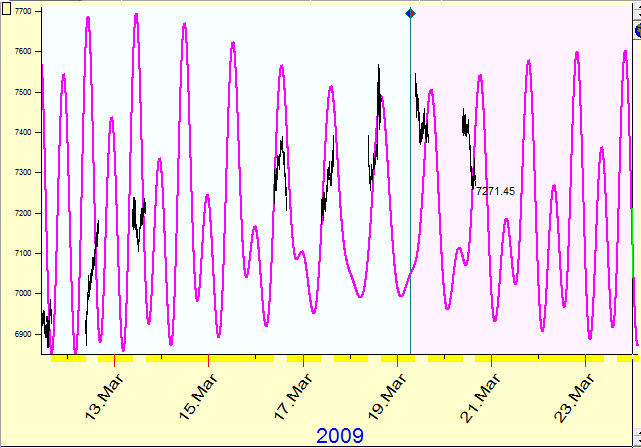
Another module, Turbo Cycles, calculates dominant cycles automatically and provides the projection line immediately, You can watch here how this module works in real time, the dominant cycles and the projection line are recalculated automatically when the new piece of price history is coming (speed up in 120 times):
You can consider these projection lines as prolonged into the future moving averages.
The "Achilles' heel" of all cyclic models applied for the stock market is the fact that the cycles do not live forever. Cycles appear and disappear, they are there for a while, and then they lose their energy and give a room for other cycles. This fact makes a huge difference between the cycles that physicists study and the cycles that work on the stock market. To handle these cycles, we have developed a special algorithm (multiframe spectrum) that allows to reveal the freshest/newly appeared/strongest cycles. To visualize a full life history of the stock market cycles, wavelet analysis module has been developed. Look at this colored diagram; red stripes here represent the periods when some cycle is strong:
You can read more about this issue here:
http://www.timingsolution.com/TS/Study/Classes/wavelet.htm. The advantage of this approach is the possibility to catch newly appearing ("fresh") cycles and calculate projection lines based on these cycles.
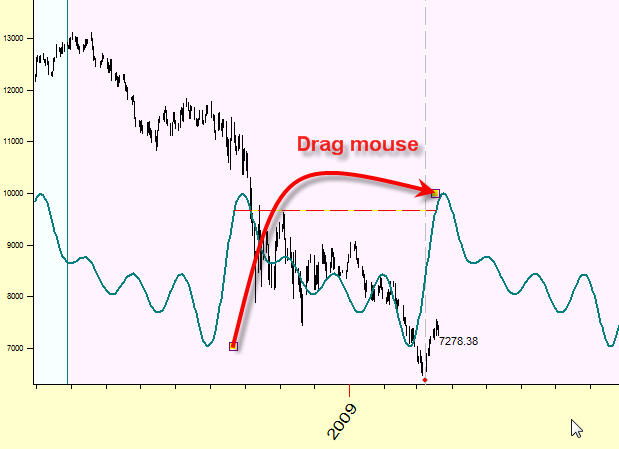
If you prefer to work with cycles manually, the Easy Cycle module is for you. You simply draw these cycles dragging the mouse from one characteristic point of the price chart to another. You can combine these cycles superposing cycles with different periods:
And vice versa: if you prefer a formal approach with the solid mathematical verification, try Back Testing module.
And there are many, many other things...
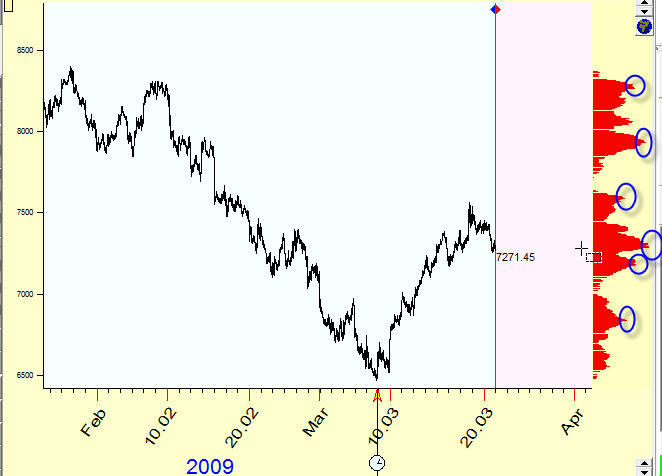
Turning Point Analyzer module allows to forecast support/resistance levels; it is based on the statistical research results.
Here the program analyses all turning points, provides their statistical analysis and displays the most probable support/resistance levels. The red stripes in the right corner correspond to the most probable support levels. This module is very popular among Timing Solution users. See here more about this module.
Price Pattern Finder. This module analyses the past price history and finds periods that are the most similar to some current situation. Look how the price chart of 1966 is similar to the current price chart (March 2009):
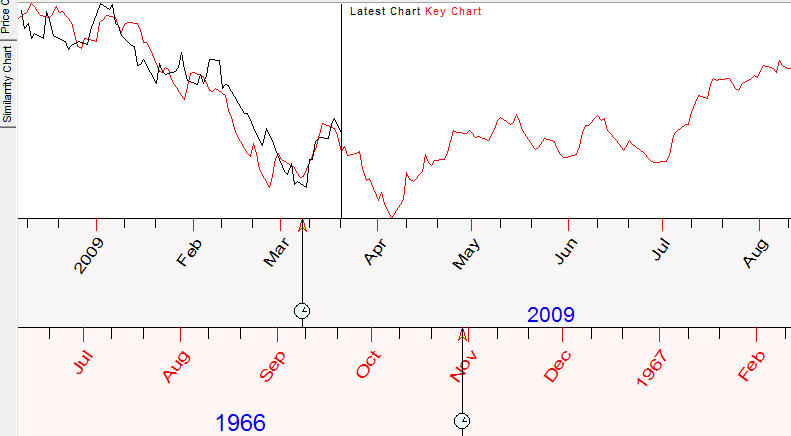
See here more about this module http://www.timingsolution.com/TS/Mini/4/index.htm
Charting Tools. Fibonacci levels, Pitchforks, Gann Angles and many other charting tools are available here:
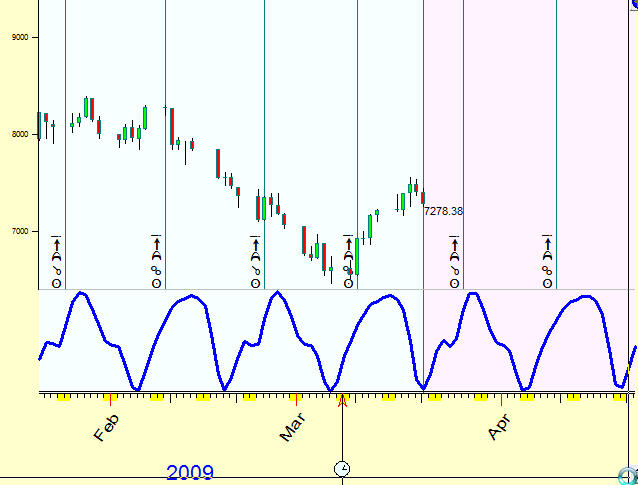
Planetary Time Charting Tool. This is another kind of cycles; we calculate the distance between these vertical lines using angle separation between two planets (Sun-Mars 15 degrees separation in this example):
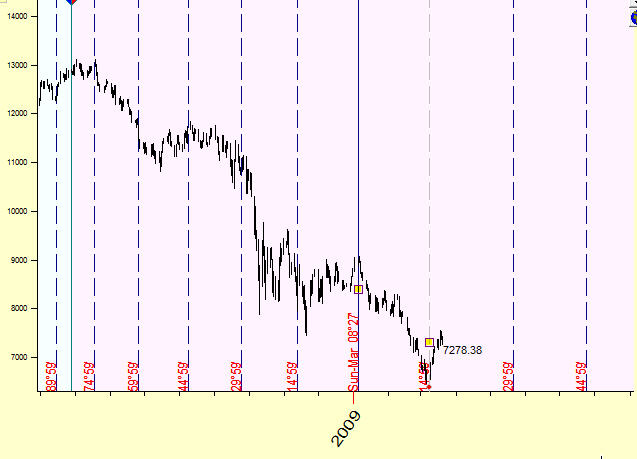
See here more about this module http://www.timingsolution.com/TS/Articles/PT/index.htm
Fourier String Charting Tool. This module performs the Fourier analysis for your price chart and calculates the projection line (that as usually can be prolonged into the future) while you are moving the mouse cursor from one point of the chart to another:
See here more about this module http://www.timingsolution.com/TS/Uphistory/Advanced/
Market and Volume Profile:
See here more about this module
Chaos theory module helps you to look deeper into the stock market structure. The most interesting part from the practical point of view is R/S analysis that provides the valuable information for Neural Network training procedure. See here more about this module.
Supporting data formats. Timing Solution supports more than 1000 different text formats, Metastock and CSI formats. It is possible to use eSignal, Interactive Brockers, MetaTrader, AmeriTrade data feeds. Also you may download the price history data through Yahoo financial service. See here more about this module.
The Demo version is here.
________________
We are aware that the projection lines produced by our program are not perfect. There is nothing surprising in it as the task of predicting the stock market's behavior is one of the most complicated ones. The good news is that every year reveals some new knowledge that improves our models and their forecasting ability. At least, it gives us a hope as we have created a system that ideally follows our knowledge regarding the markets.